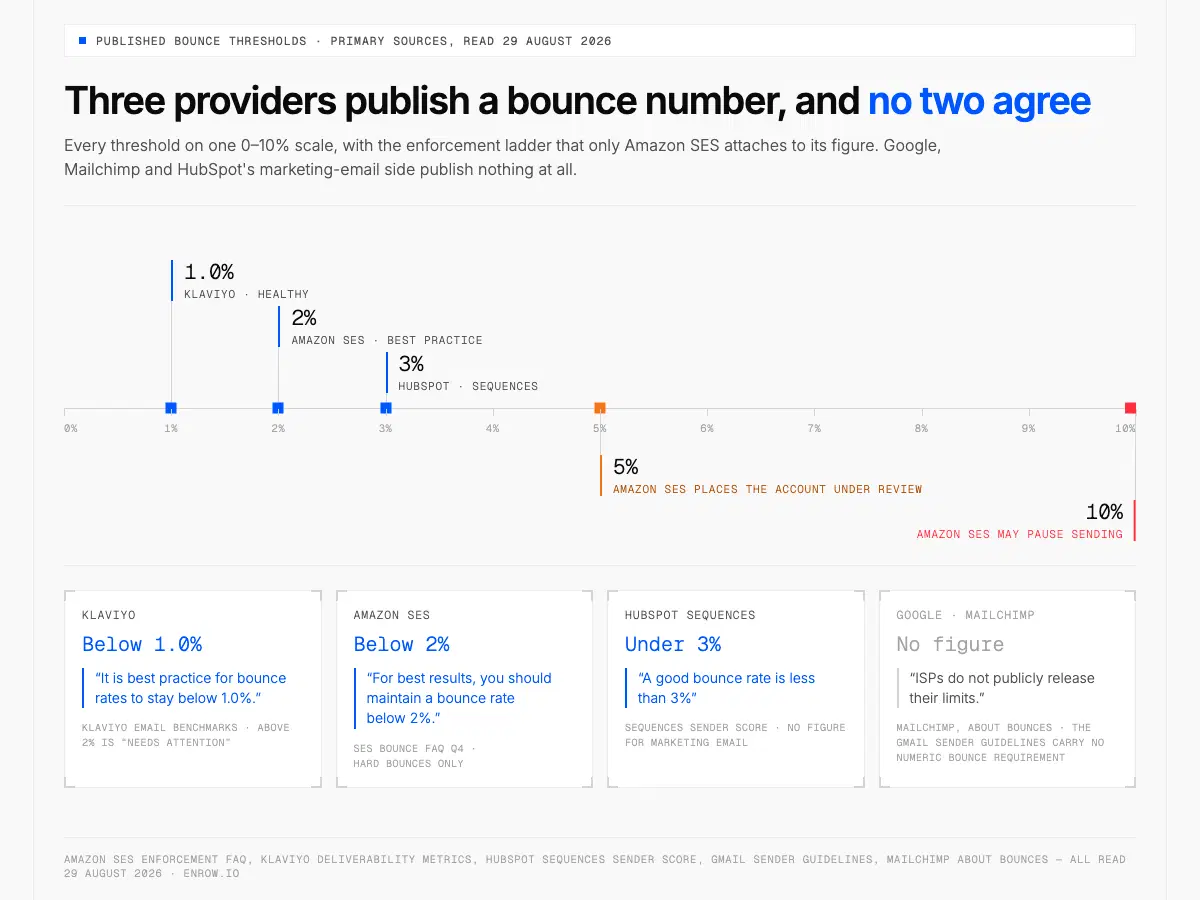
No two providers agree, and only Amazon SES backs its figure with an account review and a possible pause.
Key takeaway Email bounce rate is bounces ÷ emails sent × 100. Send 1,000, get 25 back, that is 2.5%. Three named providers publish a number, and they disagree. Amazon SES says "maintain a bounce rate below 2%", places an account under review at 5% and may pause sending at 10%. Klaviyo publishes "below 1.0%" — half of SES. HubSpot's sequences dashboard calls under 3% good. Google publishes no bounce threshold for Gmail at all. Mailchimp writes the reason down in its own help centre: "ISPs do not publicly release their limits." So the "2% industry standard" everyone quotes belongs to one cloud provider, not to an industry. SES counts hard bounces only and explicitly excludes "mailbox full" and blocked IPs. Which means 3% built out of full inboxes and 3% built out of dead addresses are not the same event, and only one of them threatens your account. Nobody publishes a cold-outbound bounce benchmark. Not an ESP, not a standards body, not a research house.
Take your bounces, divide by emails sent, multiply by 100. That is the whole formula, and it is the last simple thing on this page.
One disambiguation before the numbers, because Google conflates the two constantly. Web analytics has a metric with the same name and nothing else in common. Google Analytics 4 defines it as "the percentage of sessions that were not engaged", where an engaged session is one that lasts longer than 10 seconds, fires a key event, or reaches two or more page views (GA4 help, accessed August 29, 2026). A 42% bounce rate on a website is a Tuesday. A 42% bounce rate on an email send means the list was never checked and the domain is in trouble.
Now the part nobody does properly. Every article ranking for this query prints a threshold table, and not one of them says who published the numbers in it. I spent this morning reading the primary sources — Amazon's SES enforcement FAQ, Klaviyo's deliverability bands, HubSpot's bounce documentation, Google's sender guidelines, Mailchimp's bounce article, RFC 3463 and Gmail's SMTP error reference — and copied the wording out verbatim. Here is what they actually say, with the date I checked each one.
Disclosure before you read any of it. I run Enrow, which finds and verifies work emails, so I have a commercial interest in you caring about this number. Everything up to the last two sections is somebody else's document, quoted and linked.
Every published bounce rate threshold, in one table
Two providers publish a bounce number you can hold them to, Amazon SES and Klaviyo, and they disagree by a factor of two. A third, HubSpot, publishes a looser figure for sequences and refuses to publish one for marketing email. Google publishes nothing.
| Rate | What it triggers | Who publishes it | Their exact words | Source, checked 2026-08-29 |
|---|---|---|---|---|
| Below 1.0% | Klaviyo's "Healthy" column for bounce rate | Klaviyo | "It is best practice for bounce rates to stay below 1.0%." | Klaviyo email benchmarks |
| 1%–2% | "Room for Improvement" column | Klaviyo | Bounce rate banded at "1%-2%" in the negative-engagement benchmark table | Klaviyo deliverability metrics |
| Below 2% | Best practice, no enforcement attached | Amazon SES | "For best results, you should maintain a bounce rate below 2%. Higher bounce rates can impact the delivery of your emails." | SES bounce FAQ, Q4 |
| Above 2% | "Needs attention" column | Klaviyo | "> 2%" against Bounce rate, third column of the same three-band table | Klaviyo deliverability metrics |
| Below 3% | Counts as good on a sequence sender score | HubSpot | "A good bounce rate is less than 3%" | HubSpot sequences sender score |
| 5% or greater | Account placed under review | Amazon SES | "If your bounce rate is 5% or greater, we'll place your account under review." | SES bounce FAQ, Q4 |
| 10% or greater | Sending may be paused | Amazon SES | "…we might pause your account's ability to send additional email until you resolve the issue." | SES bounce FAQ, Q4 |
| No figure | Probation, then two warnings, then full suspension | HubSpot | Thresholds "depend on the sending volume associated with the industry of your business"; "After two probationary warnings, your email sending will be fully suspended." | HubSpot sending probation |
| No figure | Nothing published for Gmail | The sender guidelines contain no numeric bounce requirement. The only volume instruction: "If messages start bouncing or start being deferred, reduce the sending volume until the SMTP error rate decreases." | Gmail sender guidelines | |
| No figure | — | Mailchimp | "Bounce rate limits vary between ISPs and email providers, and they change throughout the year… ISPs do not publicly release their limits." | Mailchimp, About bounces |
Three of those ten rows say some version of "no number". That is not a gap in my reading. It is the position two of the largest senders in the world hold in writing, and it is why the tidy 2%/5% band chart circulating on this query has one real source behind it.
What SES's number actually measures
Quote the 5% figure and you inherit its definition, which is narrower than most people assume. SES counts hard bounces to domains you have not verified, and nothing else: "Temporary and intermittent failures such as 'mailbox full,' or bounces due to blocked IP addresses, don't count toward your bounce rate" (bounce FAQ Q3, accessed August 29, 2026). A campaign showing 4% in your ESP dashboard might be well under 1% by SES's arithmetic. Or it might not be, and you cannot tell without splitting the codes.
There is a second detail almost nobody mentions. You cannot reproduce SES's number yourself. It says so: "We don't calculate your bounce rate based on a fixed period of time… Instead, we look at a representative volume." Its own FAQ then explains that the send statistics API will not give you the figure either. So the metric that decides whether your account keeps sending is computed on a window Amazon does not disclose, from a volume Amazon selects. Plan for the ceiling, not the console.
And keep complaints in a separate column while you are in there. Amazon SES asks for a complaint rate below 0.1%, places an account under review at 0.1% or greater, and may pause sending at 0.5% or greater (complaint FAQ Q5, accessed August 29, 2026). Klaviyo bands the same metric across three columns in its deliverability table: healthy below 0.01%, room for improvement at 0.01%–0.05%, needs attention above 0.05%. Its healthy unsubscribe band is below 0.3% per campaign. Different metric, different arithmetic, routinely folded into one paragraph by people quoting both.
Hard bounce vs soft bounce
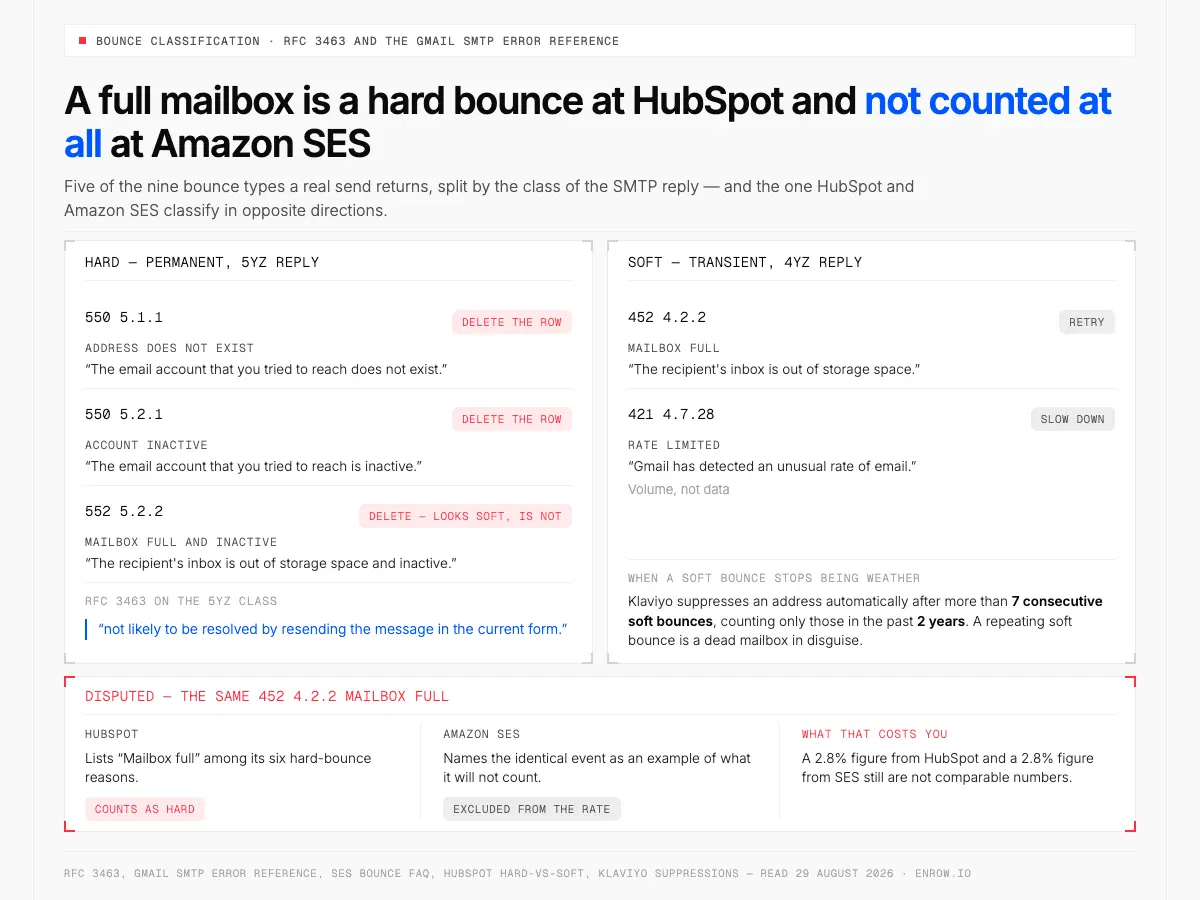
A 2.8% bounce rate at HubSpot and 2.8% at Amazon SES are not the same number.
A hard bounce is a permanent rejection: the mailbox does not exist, the domain cannot accept mail, or the server is refusing you on policy. It carries a 5yz SMTP reply, which RFC 3463 defines as a failure "not likely to be resolved by resending the message in the current form." A soft bounce is transient, carries a 4yz reply, and usually clears on retry — a full inbox, a rate limit, a server having a bad hour.
The short version of the table below: one is a dead address, the other is a bad moment.
The long version is where the money is, because your ESP shows you a category and the receiving server sent you a code. Those are not the same information. Nine bounce types cover almost everything a real send returns, and only four of them are permanent failures that land in the number Amazon SES enforces against — the other five are transient, excluded, or undocumented.
| What bounced | SMTP reply code | RFC 3463 sub-code and definition | Gmail's wording | Counts toward Amazon SES's bounce rate? | Do this |
|---|---|---|---|---|---|
| Address does not exist | 550 5.1.1 | X.1.1 — "The mailbox specified in the address does not exist" | "The email account that you tried to reach does not exist." | Yes — hard bounce | Delete the row. Never retry. |
| Domain cannot take mail | 5yz class (permanent) | X.1.2 — "The destination system specified in the address does not exist or is incapable of accepting mail" | Not in Gmail's published list | Yes — hard bounce | Delete, then check the whole domain in your file. |
| Account inactive | 550 5.2.1 | X.2.1 — "The mailbox exists, but is not accepting messages" | "The email account that you tried to reach is inactive." | Permanent, so treated as hard | Delete. A dormant mailbox never revives. |
| Mailbox full | 452 4.2.2 | X.2.2 — "The mailbox is full because the user has exceeded a per-mailbox administrative quota or physical capacity" | "The recipient's inbox is out of storage space." | No — SES excludes "mailbox full" by name | Retry. Escalate only if it repeats. |
| Mailbox full and inactive | 552 5.2.2 | X.2.2 under a permanent 5yz class | "The recipient's inbox is out of storage space and inactive." | Permanent, so treated as hard | Delete. This one looks soft and is not. |
| Policy block | 550 5.7.1 | X.7.1 — "The sender is not authorized to send to the destination" | "The user or domain that you are sending to (or from) has a policy that prohibits the email that you sent." | No — SES excludes blocked IPs | Not a list problem. Your reputation or your auth is. |
| Rate limited | 421 4.7.28 | 4.X.X — "persistence of some temporary condition has caused abandonment or delay" | "Gmail has detected an unusual rate of email. To protect our users from spam, email has been temporarily rate limited." | No — transient | Slow down. This is volume, not data. |
| Your own daily cap | 550 5.4.5 | Not applicable | "Daily user sending limit exceeded." | Not enumerated by SES | Your mailbox provider stopped you, nobody rejected you. |
| Delayed / asynchronous bounce | Accepted at RCPT TO, rejected afterwards | Not applicable | Not applicable | Not documented by SES either way | The catch-all case. See below. |
SMTP codes and sub-code definitions from RFC 3463 and Google's Gmail SMTP error reference, both accessed August 29, 2026. SES treatment from its bounce FAQ, same date.
Now the disagreement worth knowing about, because it changes what your dashboard is telling you. HubSpot lists six hard-bounce reasons and "Mailbox full" is one of them. Amazon SES names the identical event as an example of what it will not count. Same bounce, same recipient, classified permanently by one provider and ignored by the other. Nobody is wrong here, and a 2.8% figure from HubSpot and a 2.8% figure from SES still are not comparable numbers.
Soft bounces are where the "it's fine, they retry" folklore falls apart. Klaviyo suppresses an address automatically after more than 7 consecutive soft bounces, counting only those in the past 2 years. Mailchimp keeps a deliberate exception in the other direction: "If a bounced address has recently engaged with your emails, we won't remove it from your audience right away." Two providers, same signal, opposite reflexes. What both agree on is that a repeating soft bounce stops being weather and becomes a dead mailbox in disguise.
What's a good email bounce rate?
Under 2% is what Amazon SES publishes as best practice, and it is the only threshold carrying an enforcement ladder: review at 5%, possible pause at 10%, hard bounces only. Klaviyo sets a tighter bar at below 1.0%. For cold outreach, under 1% is the working target, because a cold send has no engagement history to spend.
That last figure is a choice, not a rule anyone published. A cold send often runs on a young domain with nothing banked in the account, so dead rows cost more there than they would on a five-year-old newsletter list. The target is reachable without heroics. It is what a list checked before sending produces. The method is boring and it is in bulk email verification: normalise, dedupe, run every row through live SMTP checks, split by status rather than filtering, and re-check before the next campaign rather than trusting a file from March.
Bounce rate benchmarks by sending context
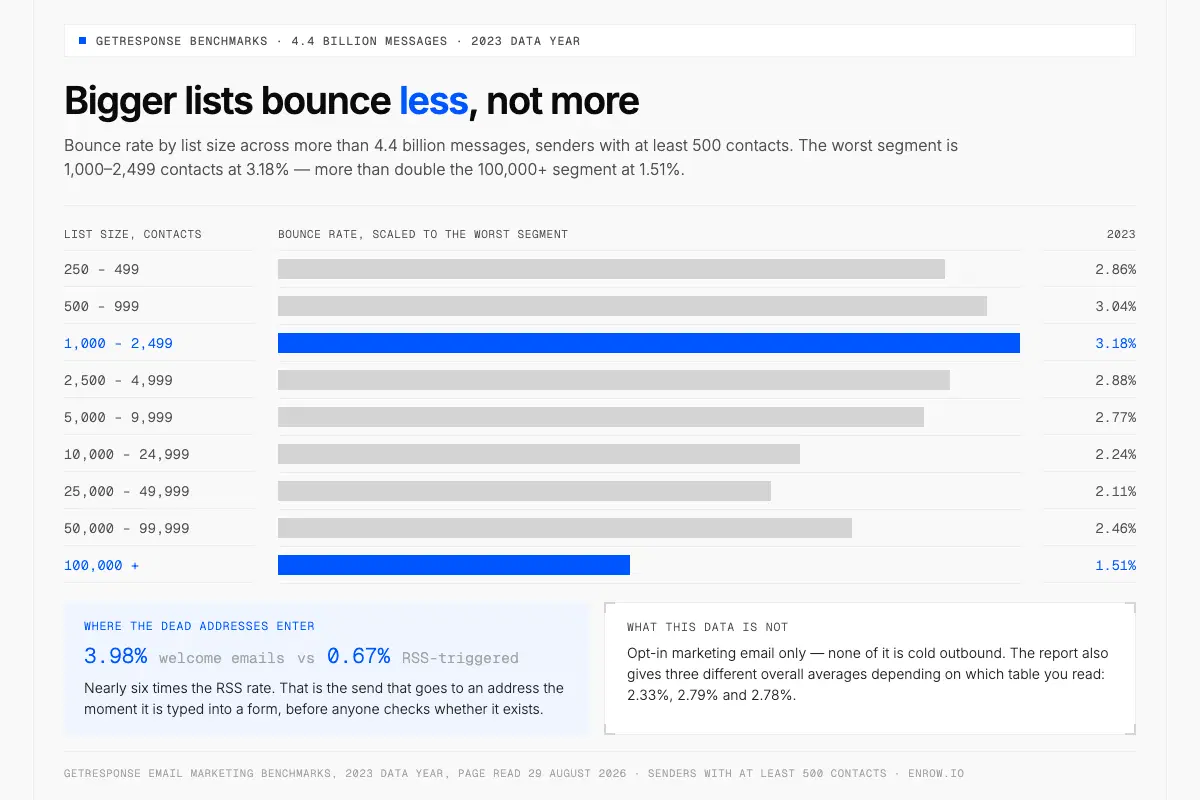
Bigger lists bounce less: 1,000 to 2,499 contacts peak at 3.18%, more than double the largest lists.
The largest public dataset on this comes from GetResponse, which analysed more than 4.4 billion messages sent by its customers in 2023, limited to senders with at least 500 contacts. Its headline average is 2.33%. And its most useful finding inverts the intuition most people bring to list hygiene: bigger lists bounce less, not more. The 100,000+ segment sits at 1.51% while lists of 1,000 to 2,499 sit at 3.18%, more than double.
| Cut of the data | Segment | Bounce rate (2023 sends) |
|---|---|---|
| Send type | RSS-triggered | 0.67% |
| Send type | Triggered | 2.38% |
| Send type | Newsletter | 2.42% |
| Send type | Autoresponder | 2.53% |
| Send type | Welcome emails | 3.98% |
| List size | 250–499 contacts | 2.86% |
| List size | 500–999 contacts | 3.04% |
| List size | 1,000–2,499 contacts | 3.18% |
| List size | 2,500–4,999 contacts | 2.88% |
| List size | 5,000–9,999 contacts | 2.77% |
| List size | 10,000–24,999 contacts | 2.24% |
| List size | 25,000–49,999 contacts | 2.11% |
| List size | 50,000–99,999 contacts | 2.46% |
| List size | 100,000+ contacts | 1.51% |
| Continent | Oceania | 1.87% |
| Continent | South America | 2.04% |
| Continent | Europe | 2.11% |
| Continent | Africa | 2.57% |
| Continent | North America | 2.68% |
| Continent | Asia | 2.73% |
Source: GetResponse Email Marketing Benchmarks, data year 2023, page accessed August 29, 2026. Opt-in marketing email only — none of this is cold outbound.
Welcome emails bouncing at 3.98%, nearly six times the RSS rate, is the tell. That is the send that goes to an address the moment it is typed into a form, before anyone checks whether it exists. Typos and throwaway addresses arrive there first.
Industry matters as much as anything else you control, and the spread is four-fold from top to bottom.
| Industry | Bounce rate (2023 sends) |
|---|---|
| Communications | 1.19% |
| Financial services | 1.79% |
| Publishing | 2.13% |
| Internet marketing | 2.16% |
| Technology & high tech | 2.23% |
| Non-profits | 2.31% |
| Legal services | 2.39% |
| Retail | 2.55% |
| Education | 2.60% |
| Restaurants & food | 2.68% |
| All industries | 2.79% |
| Travel | 2.90% |
| Health & beauty | 3.06% |
| Arts & entertainment | 3.11% |
| Agencies | 3.15% |
| Health care | 3.17% |
| Sports and activities | 3.71% |
| Automotive | 4.31% |
| Real estate | 4.86% |
Same source, same 2023 data year, same read date. Note the honest wrinkle: that report gives three different figures for its own overall average depending on which table you read — 2.33% in the continent table and the FAQ, 2.79% in the industry table, 2.78% in the country table. Different aggregations of the same corpus, unreconciled in the report itself. I have labelled which table each number came from rather than picking the flattering one.
By country the range is wider still, and unintuitive for a European reader: Poland 1.13%, Belgium 1.75%, Australia 1.77%, Canada 2.26%, Spain 2.48%, the United States 2.70%, France 2.71%, Great Britain 3.21%, Germany 3.89%, Israel 9.97%. Nor is any of this stable. North America's bounce rate fell from 4.92% in 2022 to 2.68% in 2023 in the same report. A benchmark is a photograph, not a constant.
Cold email bounce rate: the benchmark that does not exist
There is no published average bounce rate for cold outbound. I went looking for one this morning and came back with nothing: the figure ranking in the SERP today for that exact question is a LinkedIn post asserting roughly 7.5%, with no data, no sample and no source under it. Treat it as a number somebody typed.
What I can give you is the scale to judge a cold send by, and it is the SES ladder from the top of this page: under 2% as best practice, review at 5%, a possible pause at 10%, hard bounces only. A cold list has nothing banked to absorb a bad send. So the bounces it produces were mostly decided upstream, by the tool that supplied each address and by whether anything checked that address before it was handed over. Ask a supplier what happens between those two moments. How many it finds is the second question.
The one cold-list figure I will put my name to is our own, and it is an observation rather than a benchmark: addresses that clear Enrow's verifier before anybody mails them bounce under 1% on average across the files we process. That is not a promise. It also says nothing about a file nobody verified.
What a bounce actually costs you
A hard bounce is not one undelivered message. It is a data point filed against your sending domain, and the filing outlives the campaign that produced it.
HubSpot documents the most concrete version of that, and it is worth reading twice. A contact who hard bounces across three or more HubSpot accounts is given global bounce status and "dropped from future emails across all HubSpot accounts" — not yours, all of them. Reputation damage from bad addresses does not stay inside the account that sent to them. Somebody else's dirty list can retire an address before you ever touch it, and your own dirty list is doing the same thing to other people.
The SES mechanic bites differently. Because the bounce rate is computed on a representative volume rather than a fixed window, you cannot wait out a bad send. There is no Monday when the counter resets. You dilute a bad number with good sending, slowly, and in the meantime the account sits under review.
The asymmetry is the part teams underestimate. One afternoon of sending to a rotten file, then weeks of small, careful, well-received sends to climb back. I have watched a domain go from clean to spam-foldered between lunch and end of day.
Why emails bounce
Bounces are decided by list quality, not by copy. Subject lines and send times move open rates; neither one changes whether a mailbox exists. Four causes account for nearly everything I see in real files, and the first is bigger than the other three together.
Stale rows lead. People change employers and their addresses die with the badge, so any file exported months ago is decaying while it sits in your CRM. I cannot give you an honest decay percentage — the US labour statistics source I would normally cite returned a 403 this morning and I am not going to borrow a number from a blog. What I can tell you is how the decay works. A verification result describes the day it ran. Everyone who has left since is still in the file, their address spelled correctly and pointing at a mailbox that no longer exists. Without a fresh check, a nine-month-old export is not a list, it is an archive.
Guessed patterns come second. Somebody assembles first.last@company.com across 400 rows and sends it raw. A decent share is right. Every wrong one bounces, and there is no way to tell which is which without checking. The method for guessing properly, and then checking, is in how to find someone's email address.
Then the catch-alls, which bounce in a way that looks like nothing until it is too late. SendGrid separates the two mechanics precisely: a synchronous bounce is "when the remote inbox provider rejects the message during the initial delivery attempt", while an asynchronous one is "when Twilio SendGrid accepts a message for delivery, but the inbox providers reports that message as a bounce" (SendGrid docs, accessed August 29, 2026). An accept-all domain says yes at the door and rejects you in the hallway, hours later. That delay is exactly why an unresolved catch-all is not a safe row — the full mechanism is in what is a catch-all email.
Last, the boring one: dirty data. Trailing whitespace, .con for .com, first names in the surname column, a paste that shifted every row by one. Free to fix, expensive to send.
How to reduce your email bounce rate
Verify every address before every send, delete hard bounces on sight without retrying, keep catch-alls out of the file until something resolves them, and re-check anything sourced more than a few months ago. That sequence removes most of what bounces. The rest is volume discipline: Google classes you as a bulk sender above 5,000 messages a day to Gmail accounts, which is the one published figure you can plan a warm-up against.
Two habits are worth more than the rest of the list.
Group your bounce report by receiving domain before you read it. A campaign-level percentage averages the useful part away. Say a 2,000-address send comes back with four hard bounces and all four sit on one employer. That is rarely bad luck. It usually means the address pattern you applied to that company is wrong, which puts every other row you hold for the same domain under suspicion, bounced or not. Re-source the domain and four failures buy you a fix for twenty rows.
Then check your own bounce report against the codes in the table above before you react to it. 452 4.2.2 and 550 5.1.1 land in the same ESP column labelled "bounced" and mean opposite things — one is a person with a full inbox, the other is a mailbox that no longer exists. If you delete on the first and retry on the second you have it exactly backwards. HubSpot exposes this properly through its hard-bounce reason property, and the audit is written up in HubSpot CRM data quality; if the sending itself runs through sequences, the thresholds that dashboard uses are covered in the HubSpot sequences guide.
The claims circulating, against the source
Eight assertions dominate the pages ranking for these queries, and every one of them misstates its own source. The most repeated — the "2% industry standard" — turns out to be one cloud provider's best-practice line, counting one bounce type. I pulled each claim off a live result on 2026-08-29 and set it against the primary document.
| Claim in the SERP | What the source actually says | Source, checked 2026-08-29 |
|---|---|---|
| "2% is the industry standard bounce rate" | One cloud provider publishes it, as a best practice, counting hard bounces only. Klaviyo publishes 1.0%, HubSpot 3% for sequences, Google nothing. There is no industry-wide figure | SES bounce FAQ; Klaviyo; HubSpot sender score |
| "The average cold email bounce rate is about 7.5%" | No published cold-outbound benchmark exists anywhere. The source ranking for this figure today is a LinkedIn post carrying no primary citation | SERP checked August 29, 2026; no primary source exists |
| "Stay under 5% or your account gets suspended" | 5% and 10% are two different actions. "5% or greater, we'll place your account under review"; "10% or greater, we might pause your account's ability to send" | SES bounce FAQ, Q4 |
| "Google's bounce threshold is 0.3%" | 0.30% is a spam rate, not a bounce rate: "Keep spam rates reported in Postmaster Tools below 0.10% and avoid ever reaching a spam rate of 0.30% or higher." No numeric bounce threshold appears anywhere in the guidelines | Gmail sender guidelines |
| "Is a 42% bounce rate good?" | That is web analytics. GA4: "The bounce rate is the percentage of sessions that were not engaged." Unrelated to email | GA4 help |
| "Soft bounces don't matter" | Klaviyo suppresses an address after more than 7 consecutive soft bounces. And Gmail's 552 5.2.2, a full and inactive mailbox, is a permanent 5yz | Klaviyo suppressions; Gmail SMTP reference |
| "Mailbox full is always a soft bounce" | HubSpot lists "Mailbox full" among its six hard-bounce reasons. SES names the same event as one it excludes from your bounce rate. Two providers, opposite classification | HubSpot hard vs soft; SES bounce FAQ |
| "You can look up each ISP's bounce limit" | "Bounce rate limits vary between ISPs and email providers, and they change throughout the year… ISPs do not publicly release their limits." | Mailchimp, About bounces |
What prevention costs, versus what a bounce costs
Verifying a thousand addresses costs $4.25 on the cheapest paid tier and $1.99 at Scale — $2.26 apart, across plans that differ fiftyfold in credits and twenty-three-fold in price. One verification costs a quarter of a credit, so a thousand rows burn 250 of them.
| Plan | Price (USD, monthly) | Credits included | Cost to verify 1,000 addresses (USD) | Addresses verifiable per month |
|---|---|---|---|---|
| Free | $0/mo | 50 credits/mo, recurring, no card | — | 200 addresses/mo |
| Start | $17/mo | 1,000 credits/mo | $4.25 | 4,000 addresses/mo |
| Start 4k | $47/mo | 4,000 credits/mo | $2.94 | 16,000 addresses/mo |
| Pro | $87/mo | 10,000 credits/mo | $2.18 | 40,000 addresses/mo |
| Scale | $397/mo | 50,000 credits/mo | $1.99 | 200,000 addresses/mo |
Enrow's locked USD ladder, monthly billing throughout. Each cost-to-verify figure is the monthly price divided by the monthly credits, times 250. The free tier refills every month.
Four dollars and twenty-five cents to check a thousand addresses, against a week of degraded placement across every campaign on the domain. The comparison is not close, and it is the reason bounce rate is a purchasing decision more than a sending one.
Since I sell one of these, here is the disclosure and the limits in the same breath. Enrow finds and verifies work emails and direct dials in real time and bills only when a result comes back valid, so a miss costs nothing. Each address goes through 10+ verification checks — several SMTP passes plus catch-all probes from servers in different regions — and accept-all rows come back verified rather than shrugged at as risky. Whole files go through the API, or the MCP server at github.com/EnrowAPI/enrow-mcp if the work happens inside Claude or Cursor. From a LinkedIn or Sales Navigator profile, the Chrome extension writes the full verified contact into HubSpot, Salesforce or Pipedrive in one click, and that write is a create-or-update on all three, so the same prospect surfacing in two saved searches lands as one record updated twice.
Now the limits. Enrow holds no browsable contact index and will not build one, because a stored index gets re-cut on a three-to-nine-month cycle and the gap between re-cuts is exactly the decay that fills a send with dead rows. Resolving at query time is the trade. Its price is that assembling the list itself still happens in LinkedIn or Sales Navigator, not here. One balance also covers both jobs: push 40,000 rows through the verifier on Pro and the 10,000 monthly credits are spent, with nothing left over for finding anybody new. Split that budget before the upload, not after.
ready to stop wasting time?
Connected in minutes.
Verified data in seconds.
FAQ
What is a good email bounce rate?
Amazon SES publishes the most widely used figure: keep it below 2%, with an account review at 5% and possible suspension at 10%, counting hard bounces only. Klaviyo sets a tighter bar at below 1.0%. HubSpot calls under 3% good on a sequence. For cold outreach, under 1% is the realistic target for a list verified before sending.
What is an acceptable hard bounce rate?
Hard bounces are the ones providers enforce against, so the acceptable number is close to zero. Amazon SES counts only hard bounces in the rate that puts an account under review at 5% and can pause it at 10%. A verified B2B list should sit under 1% hard bounces; anything above 2% means addresses entered the file without a live check.
How do I calculate the bounce rate of an email?
Divide the number of bounced messages by the number of messages sent, then multiply by 100. A campaign sent to 5,000 addresses that returns 60 bounces has a bounce rate of 1.2%. Calculate hard and soft bounces separately as well, because Amazon SES counts only hard bounces toward its enforcement thresholds and excludes full mailboxes and blocked IPs.
Should I remove hard bounces from my email list?
Yes, immediately, and never retry them. A hard bounce is a permanent 5yz rejection, defined by RFC 3463 as a failure not likely to be resolved by resending. HubSpot goes further: a contact hard bouncing across three or more HubSpot accounts is dropped from future emails across every HubSpot account. Delete the row rather than suppressing it and re-source the contact.
Is a 42% bounce rate good?
That number is almost certainly from web analytics, not email. Google Analytics 4 defines bounce rate as the percentage of sessions that were not engaged, and 42% is ordinary for a website. In email, 42% would mean a list that was never verified and a sending domain already in serious trouble. The two metrics share a name and nothing else.
Do soft bounces hurt my sender reputation?
Isolated soft bounces are transient 4yz rejections and Amazon SES excludes full mailboxes from its bounce rate entirely. Repetition is the problem. Klaviyo automatically suppresses an address after more than seven consecutive soft bounces, counted over two years, because a mailbox that never accepts mail is functionally dead regardless of the code it returns.
What is the average bounce rate for cold email?
No ESP, standards body or research organisation publishes one. Figures circulating around 7.5% trace back to social posts with no primary source. Without a benchmark, judge a cold send against the provider scale: Amazon SES asks for under 2%, reviews an account at 5% and counts hard bounces only. A cold list verified before sending can realistically stay under 1%.
What is the difference between a hard bounce and a soft bounce?
A hard bounce is permanent, carries a 5yz SMTP reply such as Gmail's 550 5.1.1 for a mailbox that does not exist, and the row should be deleted. A soft bounce is transient, carries a 4yz reply such as 452 4.2.2 for a full inbox, and normally clears on retry. Providers disagree at the margin: HubSpot classes a full mailbox as hard, Amazon SES excludes it from the bounce rate.
How I verified this
Every threshold on this page was read off a live primary source on August 29, 2026, and quoted in the provider's own words rather than paraphrased from another article. That mattered more than usual here: not one of the pages Google is currently citing for this query attributes its numbers to anybody.
What I read today, in order: Amazon SES's enforcement FAQ (bounce Q3 to Q6 and the complaint FAQ), Klaviyo's deliverability metrics and benchmark-band articles plus its suppression documentation, HubSpot's hard-versus-soft-bounce article, its sequences sender-score page and its sending-probation and suspension pages, Google's Gmail sender guidelines, Google's Workspace SMTP error reference, the GA4 bounce-rate definition, Mailchimp's About bounces article, RFC 3463 in full, SendGrid's bounce documentation and and GetResponse's Email Marketing Benchmarks report. The claims in the SERP table came off live Google results, US English, read the same morning.
Two sources I wanted and did not get. The US Bureau of Labor Statistics JOLTS release returned HTTP 403 to every request, so no job-change or list-decay percentage appears anywhere on this page. Brevo's help centre returned 403 as well, so Brevo is absent from the threshold table rather than represented by a remembered number. And I know of no published Microsoft 365 bounce threshold; I did not fetch one today, so Microsoft is not in the table either.
Enrow's own figures were verified on August 29, 2026. The under-1% bounce is an average observed across the files Enrow processes. It is a measurement, not a promise, and nobody can refund you a bounce.
Your bounce rate is decided before you hit send, not after. Run your next list through Enrow: 10+ checks on every address, accept-all rows resolved rather than binned, and a 50-credit allowance that refills each month whether or not you ever add a card.